Along with the newly released 2.9 version of Profiler Advanced, we have improved support for memory images.
Before going into the main topics of this post, it is worth mentioning that loading and scanning times have been drastically improved for memory images. Apart from the important internal optimizations, the user is now given the choice of scanning or not the files in memory.
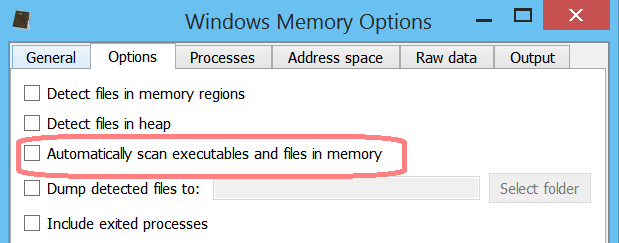
If the user chooses not to scan the files in memory right away (they are still scanned once individually opened in the UI), the loading process of the memory image takes only a few seconds if that.
One of the main news in 2.9 is the support for heap parsing for all Windows versions from Windows XP to Windows 10. The only limitation is that we don’t yet support the new heap type found in Metro/Modern applications. This new type of heap can also be found in certain Windows 10 processes such as: smss.exe, csrss.exe, services.exe, lsass.exe, svchost.exe, MicrosoftEdgeC, etc.
The heap of every process can be inspected in the UI.
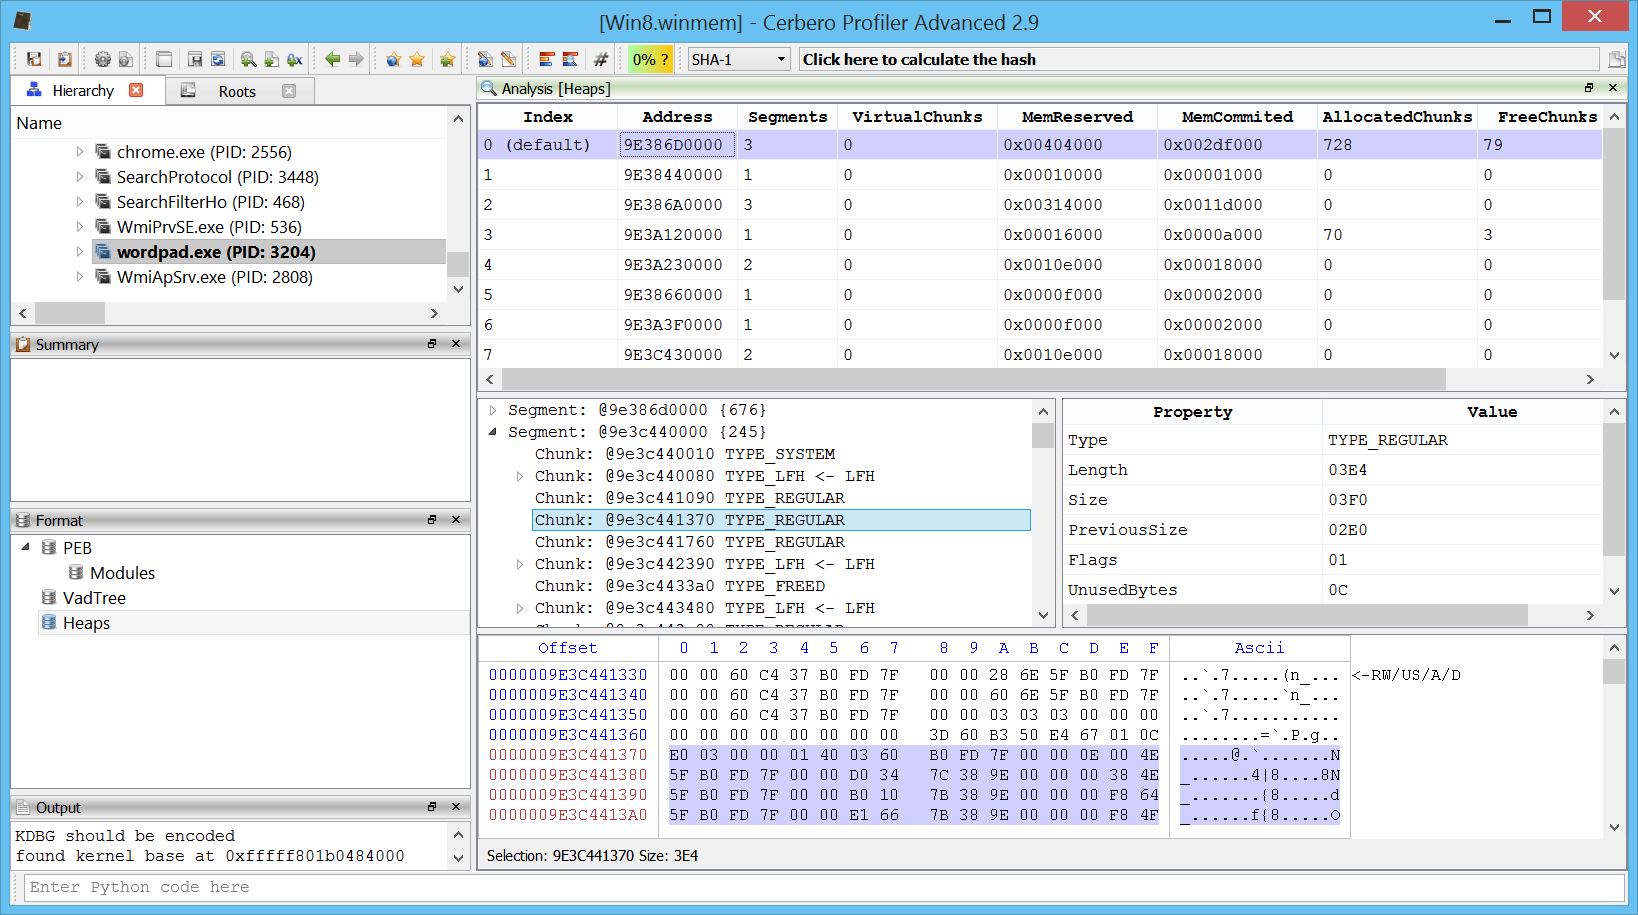
It’s not trivial to parse a heap which might also be corrupted because of paged out memory regions. We put effort into parsing what is available.
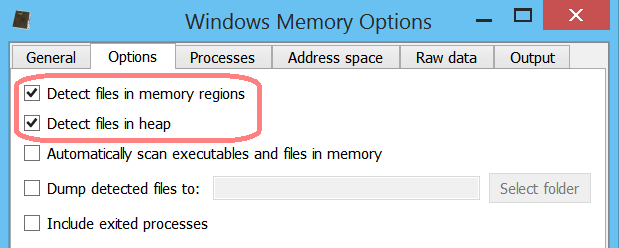
You might wonder why the effort of parsing the heap in the first place. The main reason was due to a new feature introduced in Profiler 2.9, namely file identification in memory regions. Since we anyway wanted to identify files loaded in memory regions, we thought it was a good idea to try to identify files in the heap as well. Hence, the user can now enable file identification in memory regions and heap.
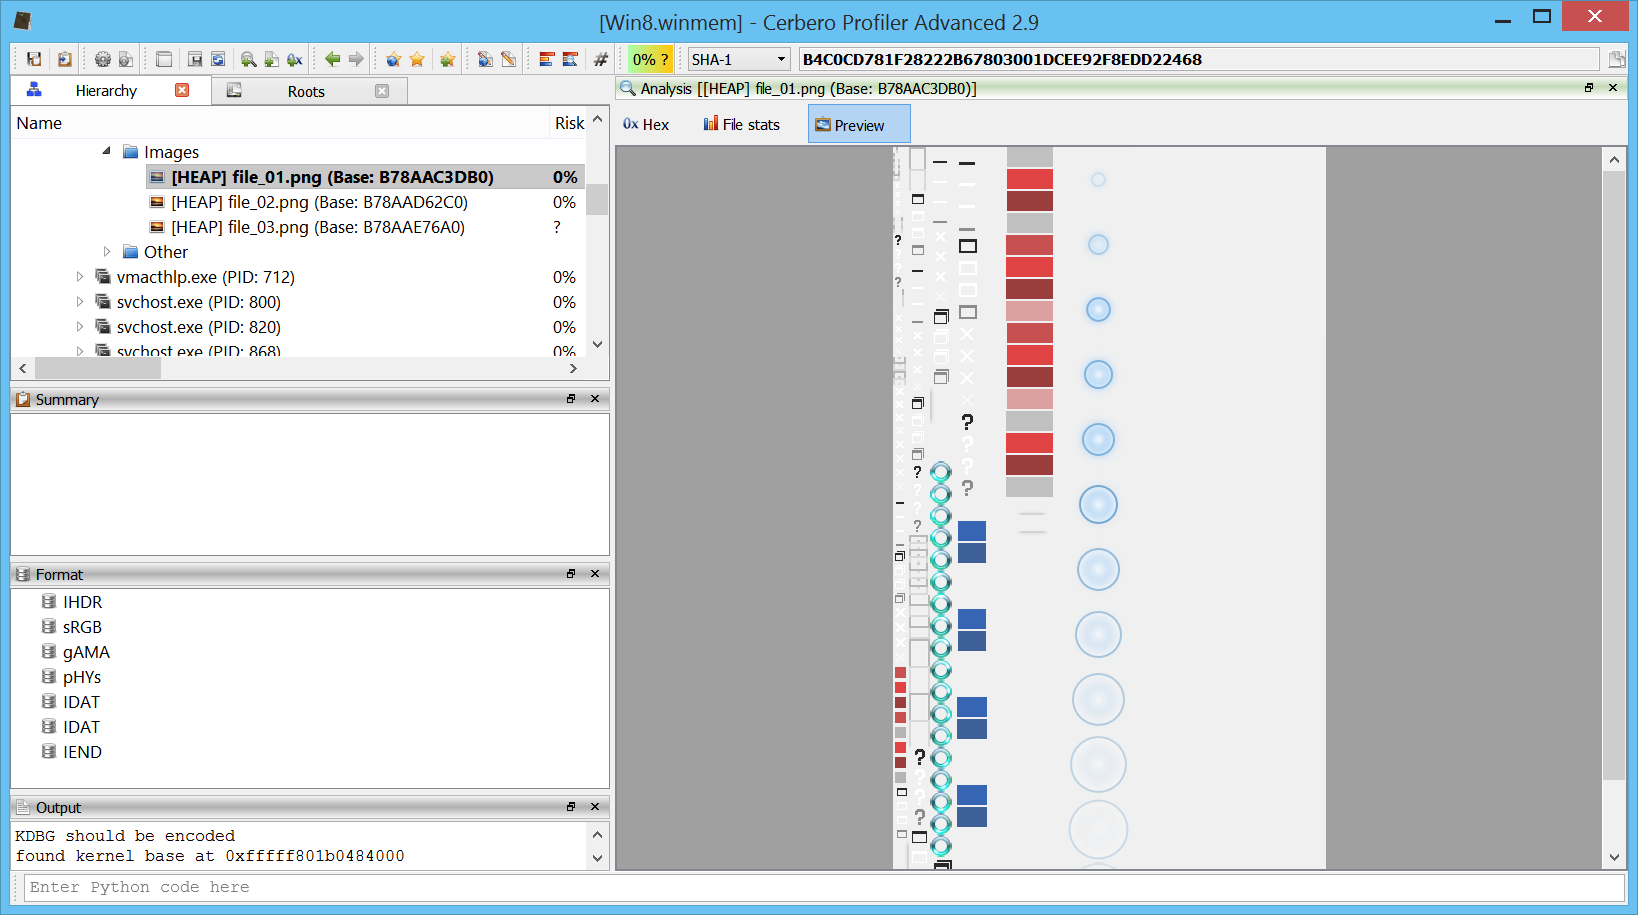
Of course, the user can inspect all the identified files in the UI. This for instance is an image found in the heap of the dwm process.
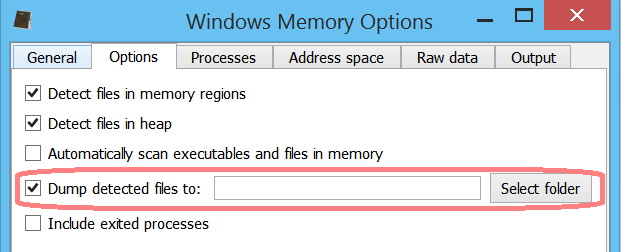
The user may also choose to dump all identified files to a specific folder.
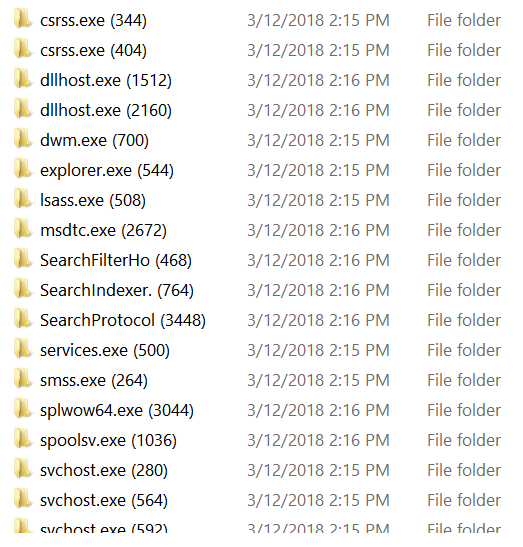
The dump output is divided into directories, one for each process.
Each process contains one or all of the following directories and an info.txt file.
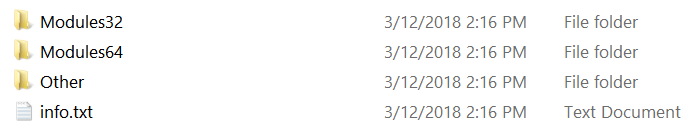
The info.txt file contains a list of dumped files and their respective names in the Profiler UI, along with possible errors:
OK: "WORDVIEW.EXE (Base: 30000000)" => "Modules64\base_30000000_WORDVIEW.EXE"
OK: "ntdll.dll (Base: 7FFDCA7A0000)" => "Modules64\base_7ffdca7a0000_ntdll.dll"
OK: "version.dll (Base: 747F0000)" => "Modules32\base_747f0000_version.dll"
OK: "comctl32.dll (Base: 71C30000)" => "Modules32\base_71c30000_comctl32.dll"
OK: "MSO.DLL (Base: 6B880000)" => "Modules32\base_6b880000_MSO.DLL"
OK: "msimg32.dll (Base: 6B3A0000)" => "Modules32\base_6b3a0000_msimg32.dll"
OK: "MSOHEV.DLL (Base: 325C0000)" => "Modules32\base_325c0000_MSOHEV.DLL"
OK: "GDIPLUS.DLL (Base: 6B1F0000)" => "Modules32\base_6b1f0000_GDIPLUS.DLL"
OK: "RICHED20.DLL (Base: 6B3F0000)" => "Modules32\base_6b3f0000_RICHED20.DLL"
OK: "sti.dll (Base: 6B3B0000)" => "Modules32\base_6b3b0000_sti.dll"
OK: "msi.dll (Base: 6B500000)" => "Modules32\base_6b500000_msi.dll"
BadFormat: "propsys.dll (Base: 71360000)" => "Modules32\base_71360000_propsys.dll"
OK: "winspool.drv (Base: 6EA40000)" => "Modules32\base_6ea40000_winspool.drv"
BadFormat: "winsta.dll (Base: 6E4C0000)" => "Modules32\base_6e4c0000_winsta.dll"
OK: "dwmapi.dll (Base: 71940000)" => "Modules32\base_71940000_dwmapi.dll"
OK: "srvcli.dll (Base: 71B60000)" => "Modules32\base_71b60000_srvcli.dll"
OK: "apphelp.dll (Base: 74600000)" => "Modules32\base_74600000_apphelp.dll"
OK: "wiatrace.dll (Base: 73F70000)" => "Modules32\base_73f70000_wiatrace.dll"
etc.
We’ll further improve this feature in the next time, so stay tuned!