Profiler 2.8 – Windows Memory Forensics

Windows memory forensics on OSX.

Profiler 2.8 is out with the following news:

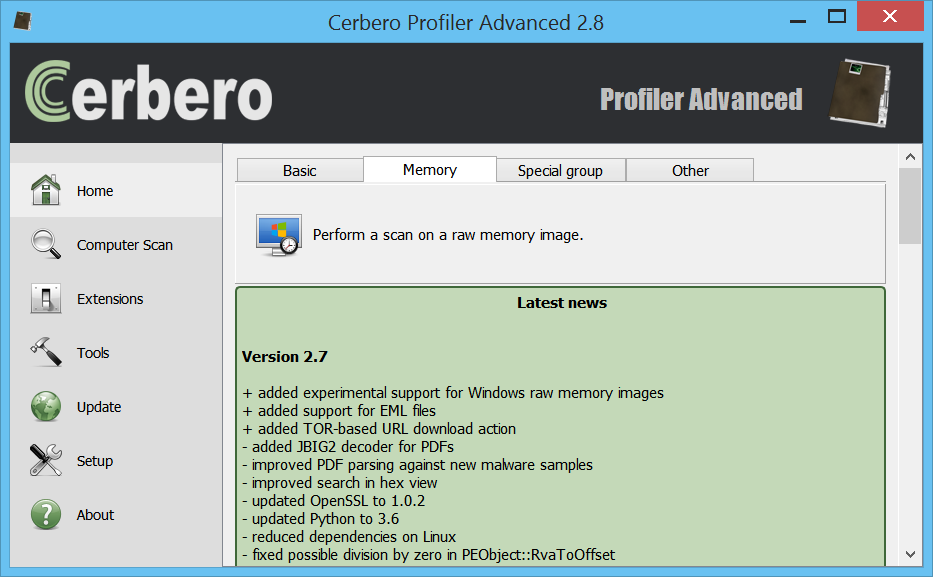
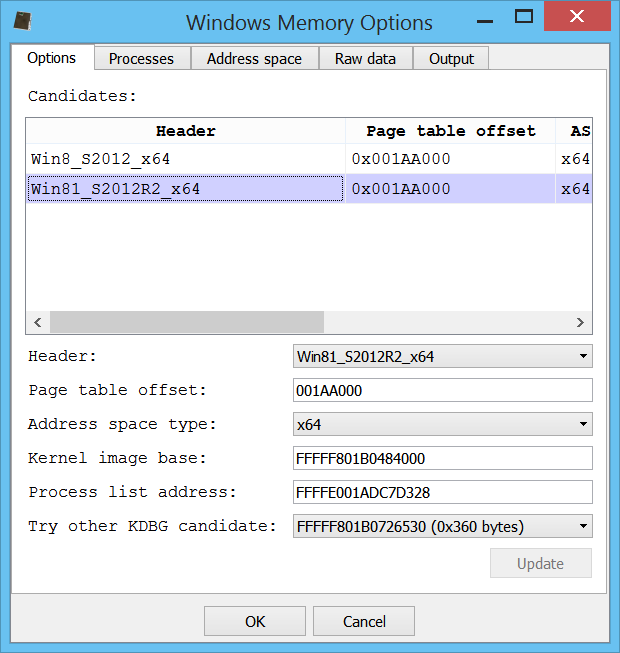
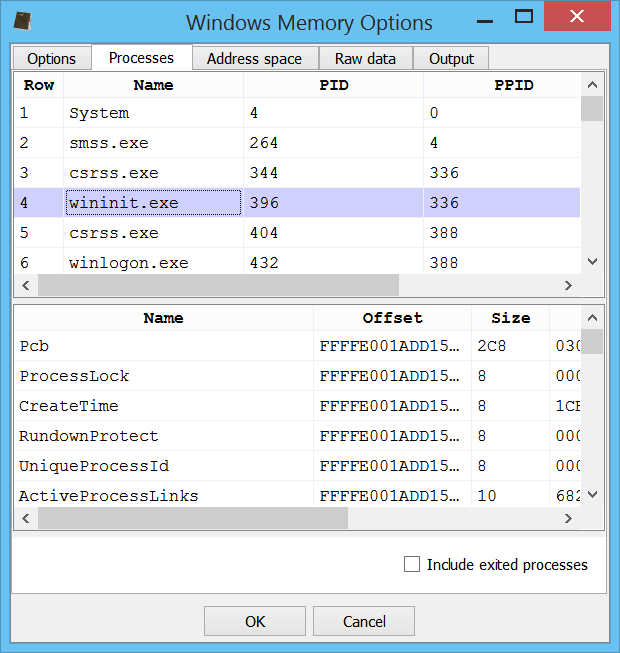
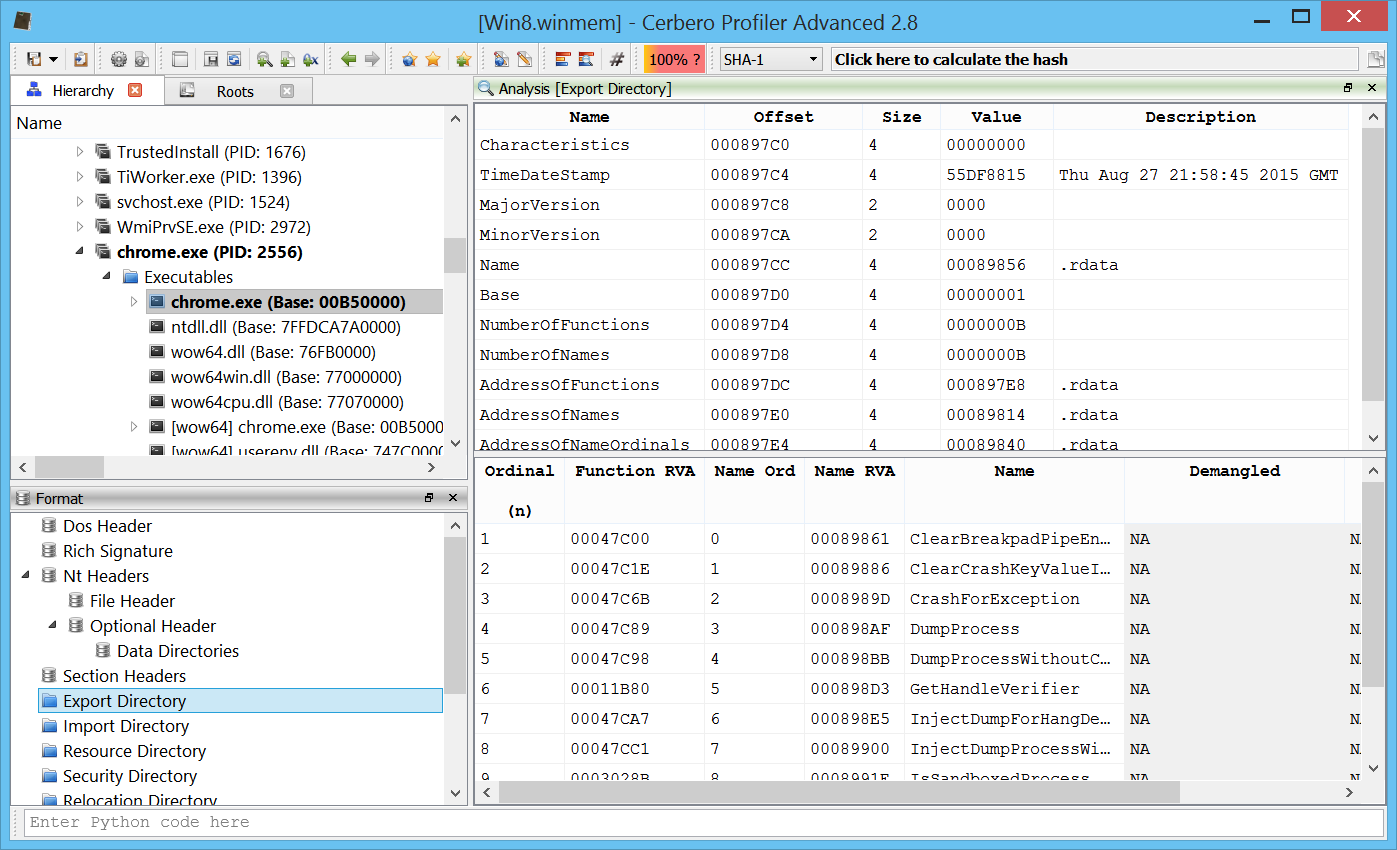
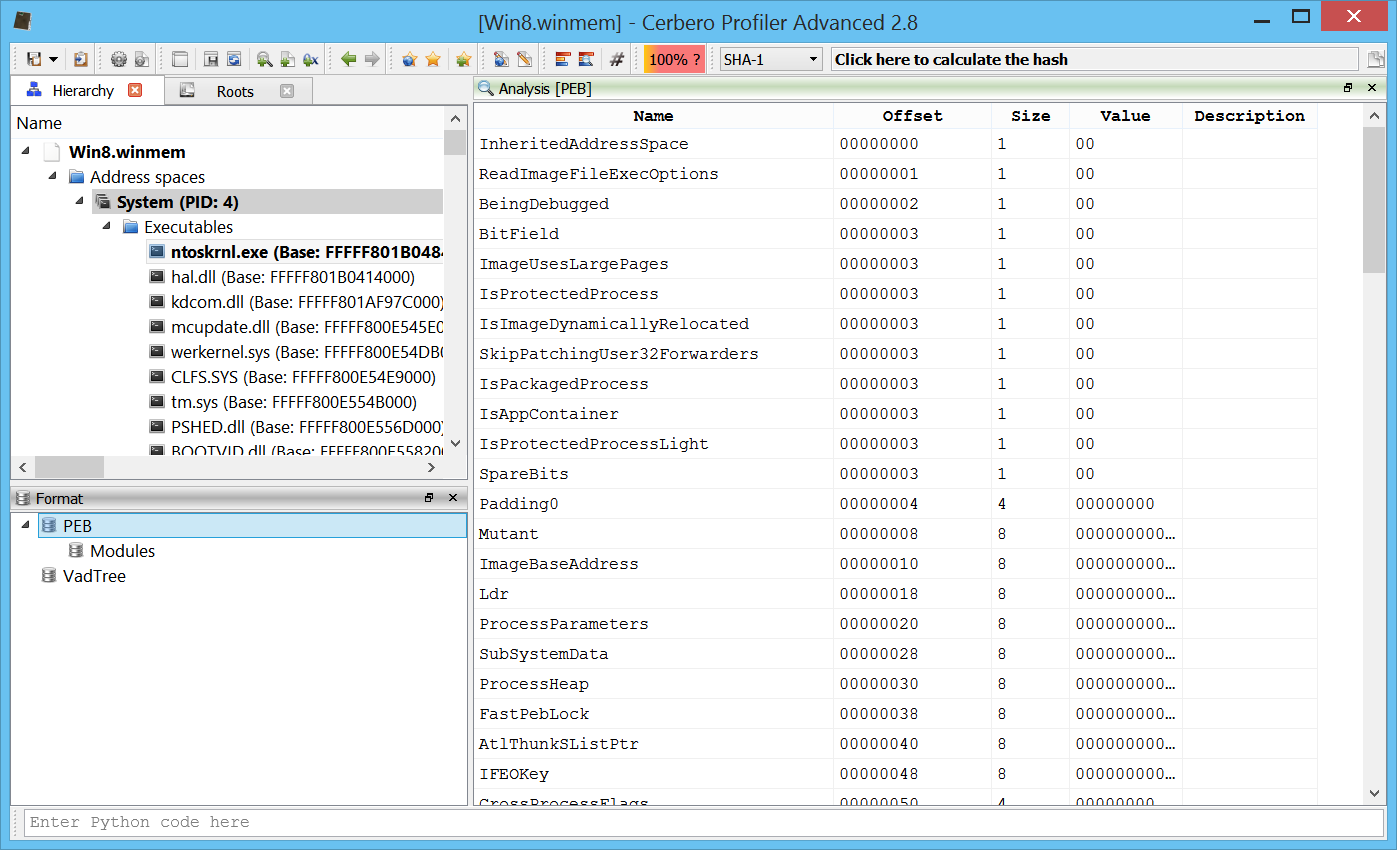
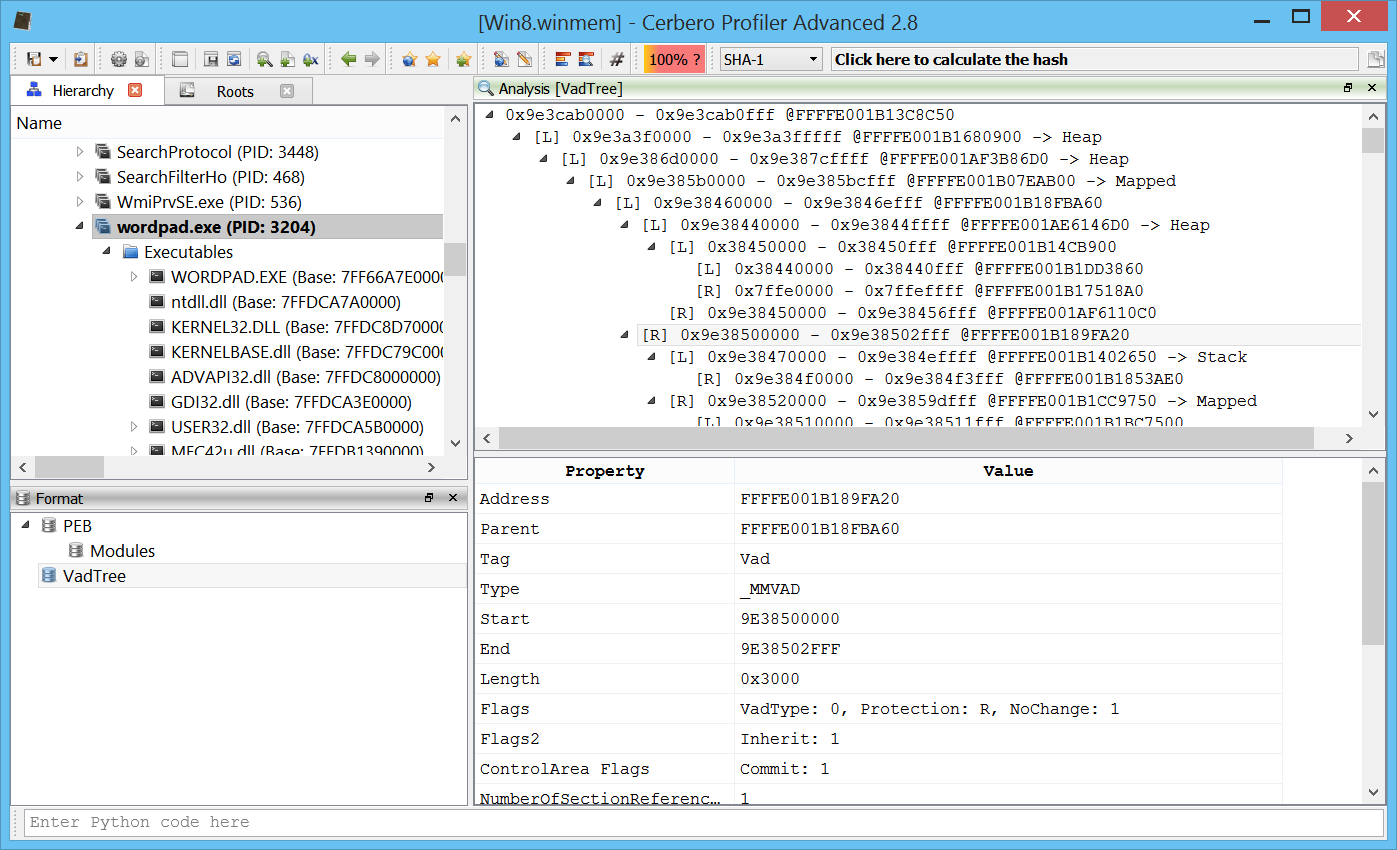
+ added support for Windows raw memory images
added unhandled exception debug tools on Windows
added unhandled exception notification for Python
– exposed tree control to the Python SDK
– improved CFBF support
– improved PDF parsing against new malware samples
– fixed PDB issue with zero-sized streams
– fixed issues in JBIG2 decoder
– fixed display of PE timestamps in UTC

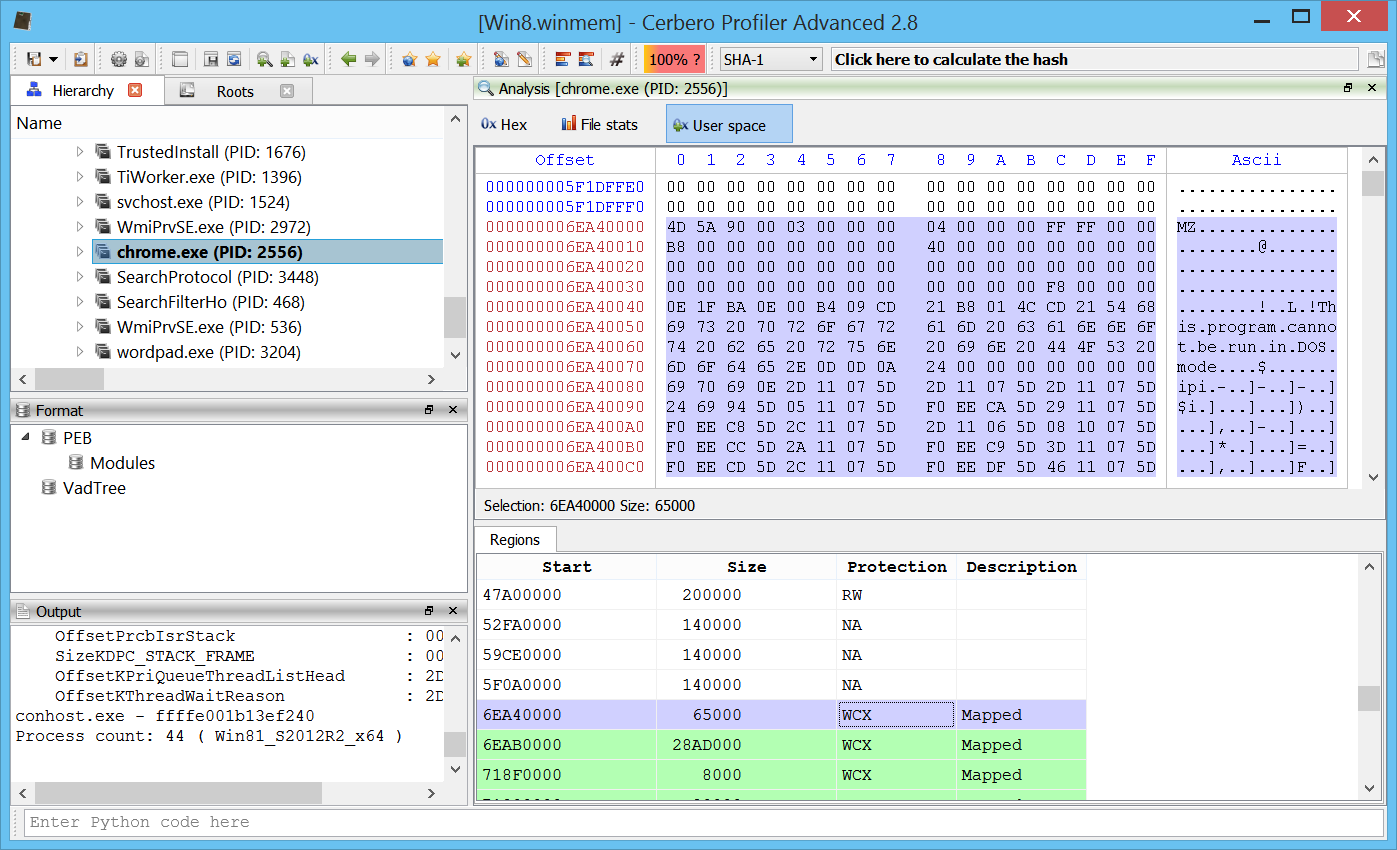
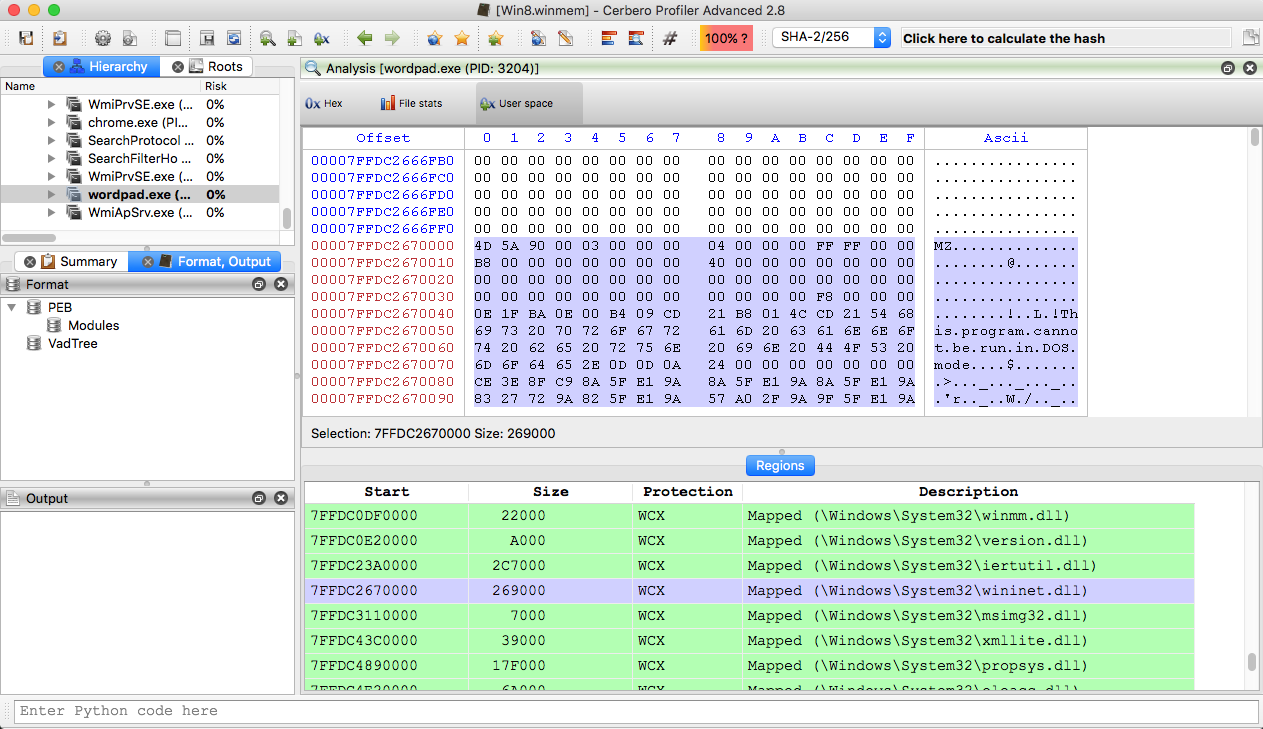
The biggest news is undoubtedly the introduction of Windows memory forensics support in the Advanced version of Profiler.

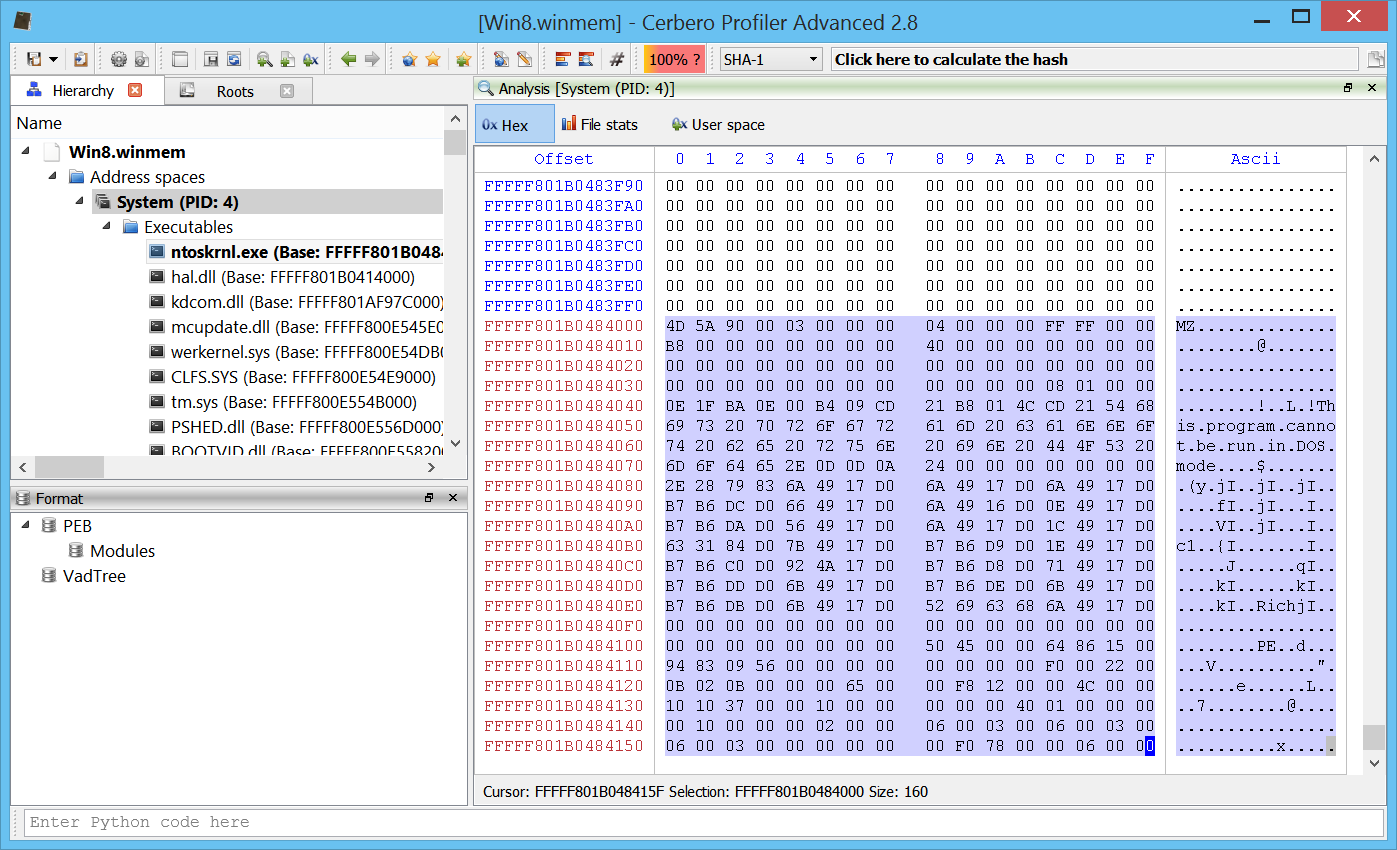
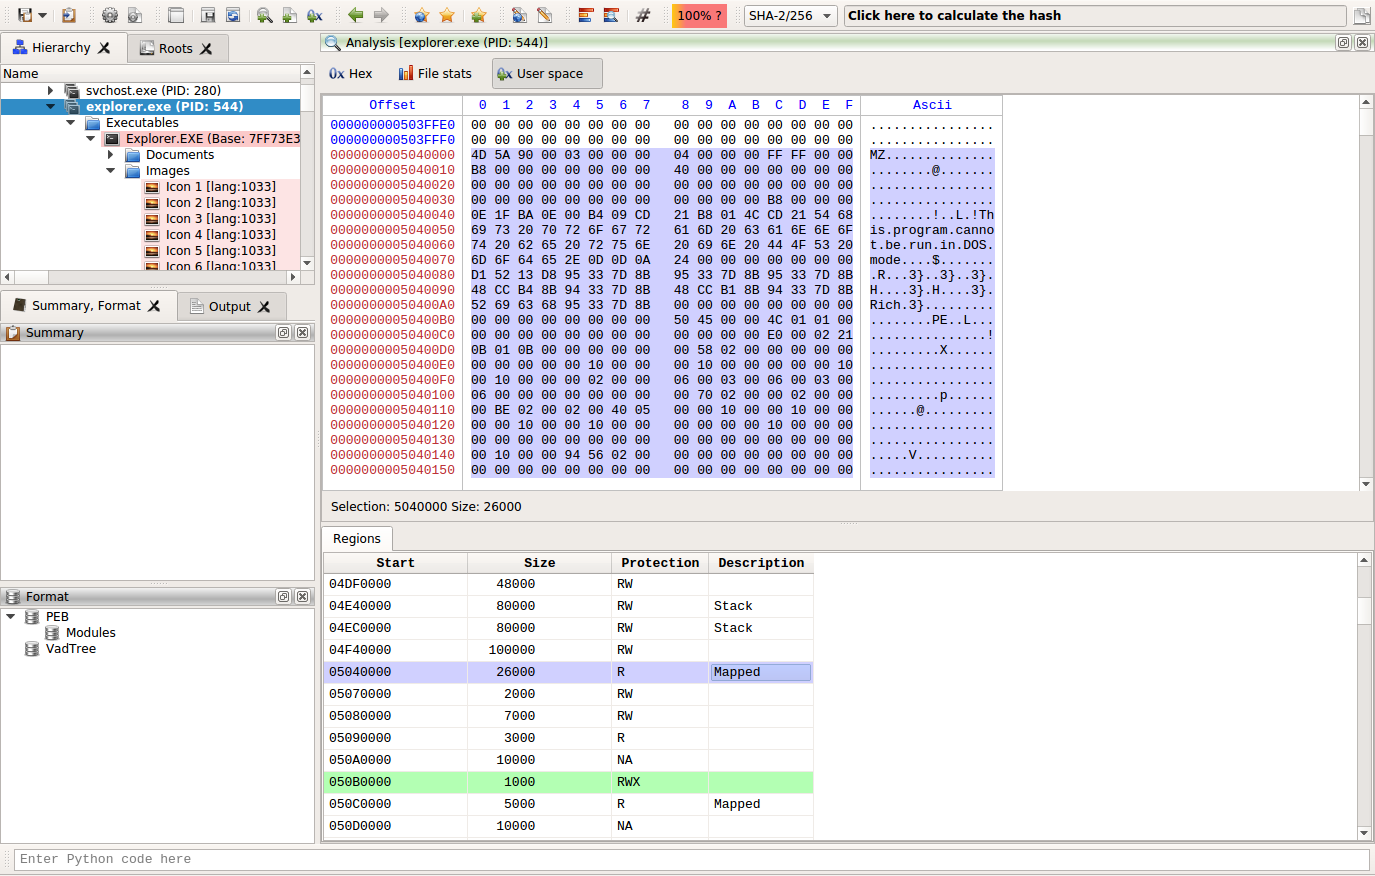
And here’s the same screenshot as above taken on Linux.

Improved Exception Handling

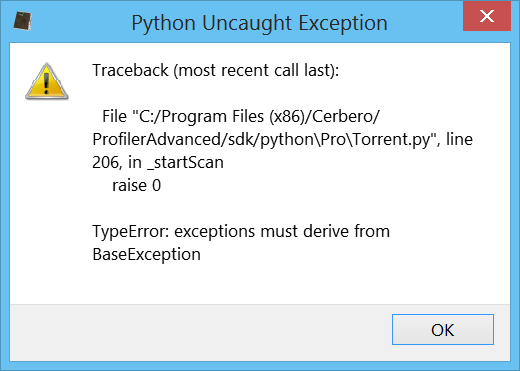
We have also drastically improved exception handling for both Python and native code, especially on Windows.

Whenever Python raises an unhandled exception a message box pops up on Windows and on other systems the exception is printed out to the terminal if it happens outside of the UI thread.

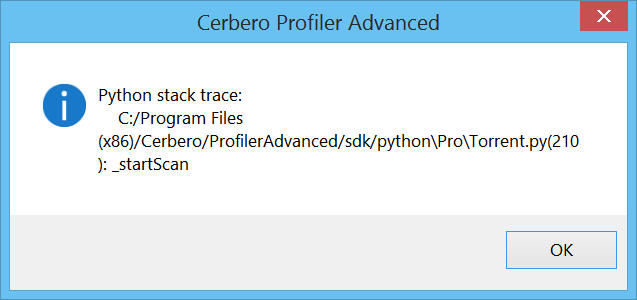
When the issue is more serious and results in a crash the user will be presented with the following message box on Windows.

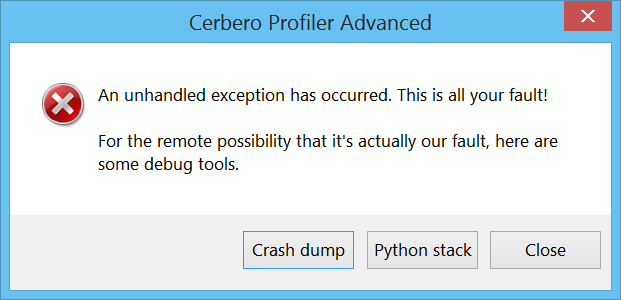
If the crash happened from Python code, the user is given the possibility to retrieve a backtrace of the last executed Python methods.

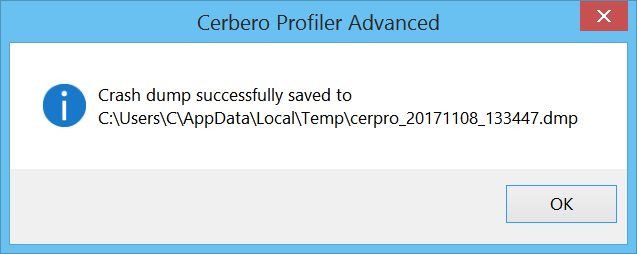
If the crash happened in the native code, it’s now possible to create a dump file.

Enjoy!

Windows Memory Forensics: Close to Release

We’re extremely proud to announce that the upcoming 2.8 version of Profiler Advanced comes with full-fledged support for raw Windows memory images! As few of our users might remember a two years old demo about this topic. Thanks to the work of the past months of our team, we could finalize that idea into a real product.

This is a hex view showing the user space regions of a process on Win8 x64.

We currently support WinXP to Win10 both x86 and x64. And, of course, the support for Windows memory forensics is available on all platforms which Profiler runs on: Windows, OS X and Linux.

Opening and exploring a raw memory image in Profiler is extremely simple. The first step is to open the memory image from the UI.

Profiler automatically tries to identify the correct Windows version and the user is presented with an options dialog, which allows modifications to the default parameters.

If the user decides to modify the parameters, he can verify the correctness of the results by exploring processes and other parts.

Once the users is satisfied with the configuration, he may press “OK” and let Profiler analyse the image. Once the detection and analysis of embedded modules and files is finished, the user is presented with the workspace.

In the workspace the user can explore executables loaded in memory (Wow64 is supported).

He may explore the PEB of a process.

Or its VAD tree.

The System Service Descriptor Table (SSDT).

The Processor Control Block (KPRCB).

And of course explore kernel memory and drivers as well.

As usual, once the initial analysis is finished, everything can be saved into a project along with notes, bookmarks, layouts and so on. Loading a memory image from a project is immediate and saves a lot of time when analysing the same memory image multiple times.

This is just the beginning: we have many ideas and expect to release more frequently than in the past. I’m sure, we’ll be able to pleasantly surprise you!