The upcoming 0.9.5 version of the Profiler introduces tools to interactively analyze JavaScript code. In a few words it adds the capability to execute snippets of code or to debug them. The JavaScript engine used is the one in WebKit.
Let’s take a look at the newly introduced actions:
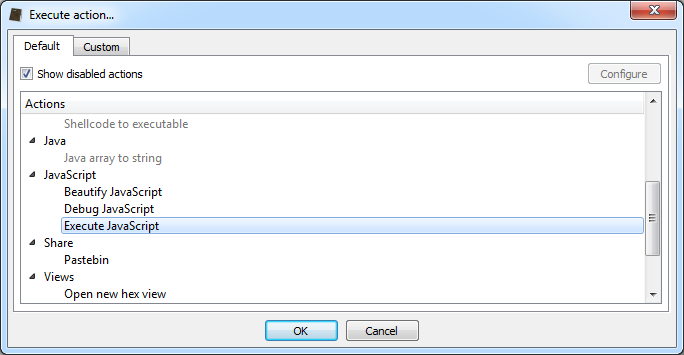
The ‘Execute JavaScript‘ action executes a script and lets the user decided whether to process ‘eval‘ calls or not.
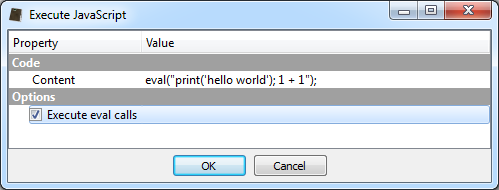
Even when ‘eval‘ calls are not being processed, the argument is still printed out for the user to inspect. And in case ‘eval‘s are performed, then the result (if any) is printed out as well.
js_eval: print('hello world'); 1 + 1
js_print: hello world
js_eval_result: 2
Let’s take a look at the same code under the JavaScript debugger. Given the JavaScript debug capabilities already in Qt, it was easy to integrate a full fledged debugger:
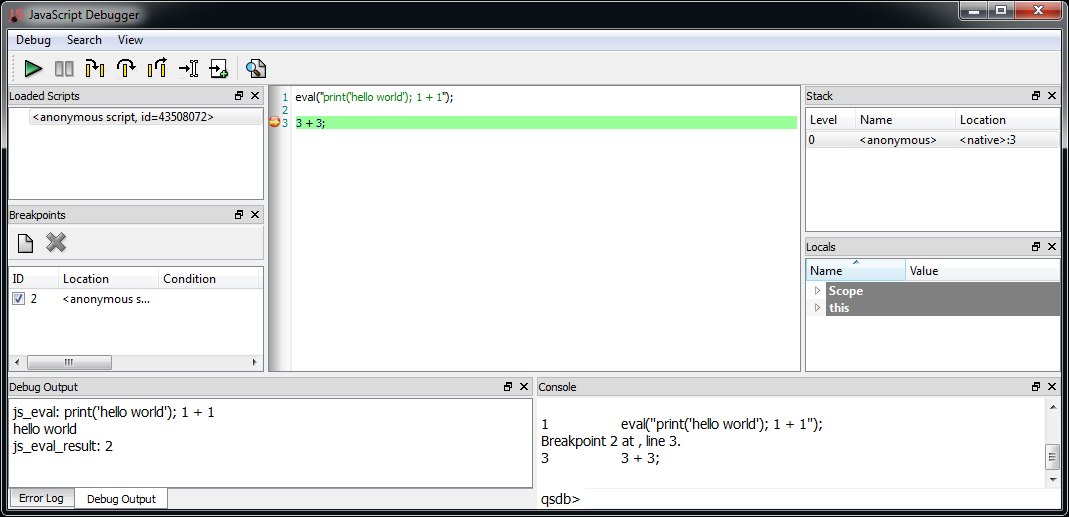
The debugger can be executed as a stand-alone utility (jsdbg.exe) as well.
It shouldn’t take long before the new version is ready and then we’ll see these features in action against some real world samples. Stay tuned!